Reports
AllMy Ledger includes 15 built-in reports organized into four categories: Financial, Detail, Receivables & Payables, and Tax. Every report can be exported as PDF, CSV, or XLSX.
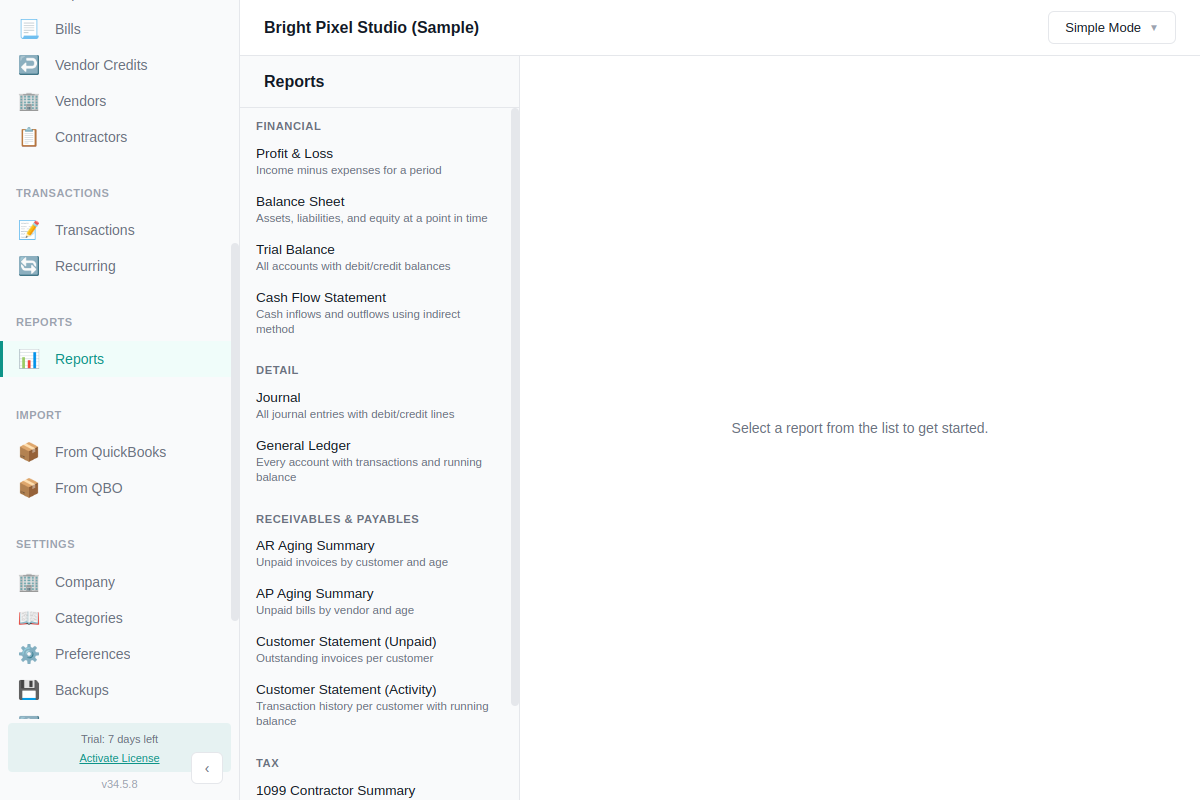
Running a Report
- Click Reports in the sidebar
- Select the report you want from the list
- Choose a date range from the preset dropdown, or pick Custom Range to set specific dates
- The report generates automatically when you change the date
Date Presets
Every report has a date preset dropdown. The default is This Month.
| Preset | Date Range |
|---|---|
| All Time | Earliest transaction through today |
| This Month | First through last day of the current month |
| This Quarter | First through last day of the current calendar quarter |
| This Year | January 1 through December 31 of the current year |
| Last Month | Previous full month |
| Last Quarter | Previous full quarter |
| Last Year | Previous full year |
| Custom Range | Pick your own start and end dates |
For as-of-date reports (Balance Sheet, Trial Balance, AR/AP Aging, Customer Statement Unpaid), the end date of the selected range is used as the as-of date.
Display Options
- Hide zero balances — Hides line items with $0.00 amounts
- Show account numbers — Prepends account numbers to account names
These apply to the summary reports (Trial Balance, Balance Sheet, Profit & Loss). The General Ledger has its own account and transaction-type filters instead.
Financial Reports
Profit & Loss (Income Statement)
Shows your income and expenses over a date range. Use this to see how much you earned and spent in a month, quarter, or year. The bottom line is your net income (or loss) for the period.
Balance Sheet
Shows your assets, liabilities, and equity as of a specific date. Use this to see your overall financial position — what you own, what you owe, and your net worth in the business.
Cash Flow Statement
Shows where cash came from and where it went during a period. Uses the indirect method — starts with net income and adjusts for changes in balance sheet accounts. Organized into three sections:
- Operating Activities — Net income adjusted for changes in receivables, payables, and other working capital
- Investing Activities — Changes in equipment, vehicles, and other long-term assets
- Financing Activities — Loan proceeds/repayments and owner contributions/withdrawals
The summary shows beginning cash, net change, and ending cash. If the numbers don't reconcile, a warning banner explains possible causes.
Trial Balance
Lists every account with its debit or credit balance as of a specific date. Total debits must equal total credits. Use this to verify your books balance before closing a period or sharing reports with your accountant.
Detail Reports
Journal
A chronological record of every journal entry for a date range. Shows the date, accounts, debits, credits, and memo for each entry. Useful for auditing and tracing specific transactions.
General Ledger
Complete transaction listing organized by account. Shows every transaction that affected each account during the date range, with an opening balance, a running balance, and a total per account. Each line shows the date, transaction type, contact (the linked customer or vendor), reference, description, and memo. Manual journal entries are labelled "Journal Entry". Use this for detailed account-level analysis.
Two filters narrow the report:
- Accounts: pick one or more accounts to show, grouped by account type with a select-all option. The list includes only accounts with activity in the date range. Leave it empty to show every account. A Clear button restores all.
- Transaction type: limit the report to a single type of transaction, such as invoices or journal entries.
The opening balance, running balance, and totals recompute for whatever you have filtered to. The PDF export is landscape to fit the extra columns. The account number and name always appear in each account's section header, so the report-wide "Show account numbers" and "Hide zero balances" options do not apply here.
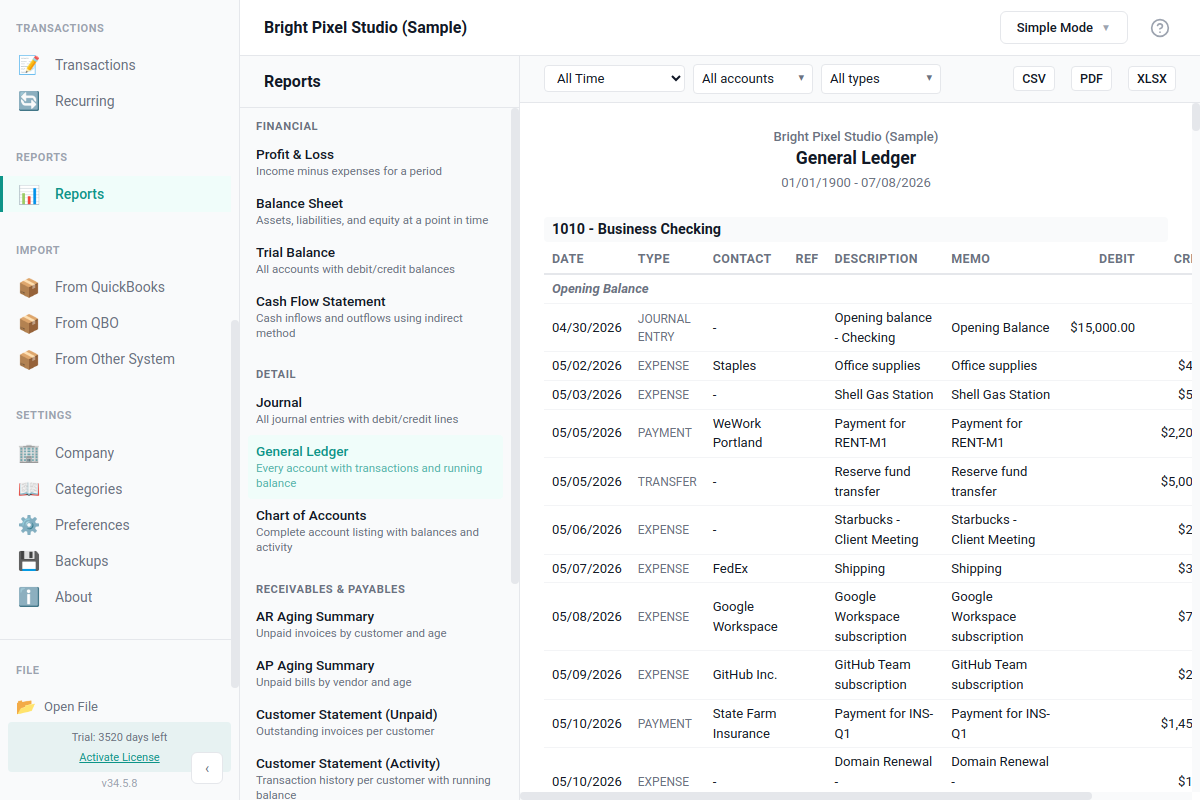
Chart of Accounts
A complete listing of every account in your books with its current balance, transaction count, hierarchy path, and metadata. Use this when you need to share your account structure with an accountant, audit your setup, or check which accounts are unused.
The Excel export includes 13 columns with auto-filter and conditional formatting: inactive accounts in grey, negative balances in red, and accounts missing a Schedule C tax line in italic. The PDF export is landscape with a 7-column subset.
This report is part of the Accountant Export Package and is the easiest way to hand your chart of accounts to a CPA at year end.
Receivables & Payables Reports
AR Aging Summary
Shows unpaid invoices grouped by how long they've been outstanding — Current, 1-30 days, 31-60 days, 61-90 days, and 90+ days. Use this to follow up on late payments.
AP Aging Summary
Same structure as AR Aging, but for your unpaid bills. Shows what you owe to vendors grouped by aging period.
Customer Statement (Unpaid)
Lists all unpaid or partially paid invoices for each customer as of a specific date. Shows the invoice number, date, due date, original amount, and remaining balance. Fully paid invoices are excluded.
Use the customer dropdown to view all customers at once or filter to a single customer. Each customer section has a subtotal, and a grand total appears at the bottom when viewing all customers.
Customer Statement (Activity)
Shows a complete history of invoices and payments for each customer over a date range — the classic account statement. Includes an opening balance from prior activity, each transaction with charges and credits, and a running balance.
Use this when a customer asks "what do I owe?" or when you need a full account history. The closing balance at the bottom shows what the customer owes at the end of the period.
Customer List
Lists every customer with name, company, email, phone, address, payment terms, and current open AR balance as of a chosen date. Use this when you need a printable directory of who you bill, or to share contact details with someone on your team.
Filters: as-of date for the open balance, and an "Include inactive contacts" toggle. Inactive customers are hidden by default, and shown with an "(inactive)" suffix when the toggle is on.
The PDF export is landscape Letter with a multi-line address cell. The XLSX and CSV exports break the address into discrete Street, City, State, Zip, and Country columns so you can sort or filter in Excel.
Vendor List
Companion report to Customer List. Lists every vendor with the same contact fields plus a 1099 Yes/No column and the open AP balance you owe them as of a chosen date.
Filters: as-of date, include inactive contacts, and "1099 vendors only" to narrow the list to contractors you'll send a 1099-NEC. The 1099-only toggle is hidden on the Customer List since it does not apply.
Same export formats as Customer List. The Open Balance column on both reports is computed in your base currency. If you have foreign-currency vendors, balances are converted using the same logic as AR/AP Aging.
Tax Reports
1099 Contractor Summary
Lists each 1099 contractor and their total payments for the year. See 1099 Tracking for details on setting up contractor tracking.
Schedule C
Groups your income and expense totals by IRS Schedule C line number. If you're a sole proprietor filing Schedule C (Form 1040), this report lets you transfer totals directly to the corresponding lines on your tax form.
Each row shows a Schedule C line (e.g., "Line 1 — Gross receipts or sales"), the combined total from all accounts assigned to that line, and the contributing account names. Summary rows show Total Income, Total Expenses, and Net Profit (Line 31).
Setting Up Tax Line Assignments
For an account to appear on the Schedule C report, it needs a tax line assignment:
- Go to Categories (Chart of Accounts) in the sidebar
- Click the account you want to assign
- In the edit form, find the Tax Line (Schedule C) dropdown
- Select the appropriate Schedule C line
- Save the account
The default chart of accounts comes pre-configured with tax line assignments for all standard accounts. Only custom accounts you've added need manual assignment.
Unmapped accounts: If any income or expense accounts have transactions but no Schedule C line assigned, a warning banner shows the unmapped totals. Check Categories to assign the missing tax lines.
Exporting Reports
Every report can be exported in three formats using the buttons at the top of the report:
- PDF — Formatted document with your company name, report title, and date range. Opens in your default PDF viewer.
- CSV — Comma-separated values for Excel or Google Sheets. Opens a save dialog.
- XLSX — Excel workbook with formatted headers and number columns. Opens in your default spreadsheet app.
Customer statements include page breaks between customers when exported as PDF. See Data Export for more options.
Tip: Run a Profit & Loss report monthly to track how your business is doing. Compare month-to-month to spot trends. Run a Cash Flow Statement quarterly to make sure your business is generating enough cash to cover expenses.
Quick Reference
| Report | Category | Date Filter |
|---|---|---|
| Profit & Loss | Financial | Date range |
| Balance Sheet | Financial | As-of date |
| Cash Flow Statement | Financial | Date range |
| Trial Balance | Financial | As-of date |
| Journal | Detail | Date range |
| General Ledger | Detail | Date range |
| Chart of Accounts | Detail | As-of date |
| AR Aging Summary | Receivables & Payables | As-of date |
| AP Aging Summary | Receivables & Payables | As-of date |
| Customer Statement (Unpaid) | Receivables & Payables | As-of date |
| Customer Statement (Activity) | Receivables & Payables | Date range |
| Customer List | Receivables & Payables | As-of date |
| Vendor List | Receivables & Payables | As-of date |
| 1099 Contractor Summary | Tax | As-of date |
| Schedule C | Tax | Date range |